Before we dig into the 3 options, let’s first cover why site visit stats are helpful. WTF is a site visit? Well the bad news is that different tracking options define it a bit differently, but the good news is that the idea is the same overall. A site visit is a unique individual coming to your website.
How things get a bit varied is what each tracking option defines as unique. For some, it’s device specific (tied to your laptop or smartphone), while for others it’s IP address specific.
What matters for you is that you can see how traffic is growing over time, look at any crazy spikes in traffic to determine the cause + understand how many potential customers or subscribers you have coming to your online home (your site) every single day.
Now that you know what site visits are, let’s dig into the ways you can track them.
Google Analytics

I’m sure you’ve heard of analytics before. and you might even have it on your site but have zero idea what to look at when you log into your google analytics dashboard. and that’s ok!
If you don’t already have it installed, head to google.com/analytics to get your free account. They will provide you with some tracking code that needs to be installed on your site in order for things to work. (And if you aren’t game for adding that code in yourself, I’d recommend grabbing a Google Analytics plugin for your site where you simply tell it what your Google Analytics number is + the plugin does the rest.)
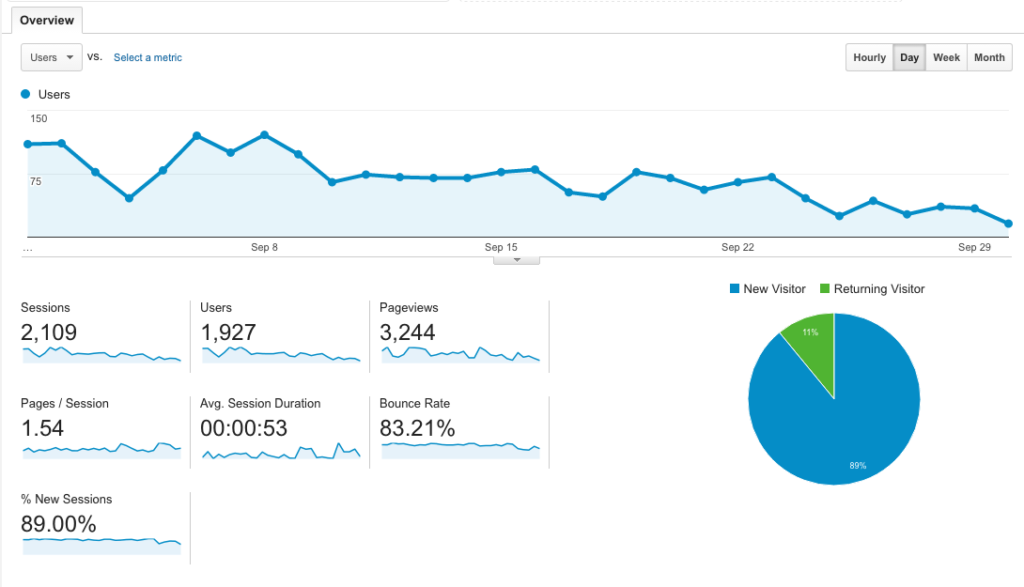
Once it’s installed + has been running for at least 24 hours, you can log into your dashboard. Head to Audience > Overview to view your data.
While all of the info can be interesting, we are going to focus on the Sessions number + Users number. Why I like focusing on Sessions is because it groups a users actions into one. So if you came to my site + visited 5 different pages, that would up my Pageviews but keep my Sessions at 1 + my Users at 1.
When your Sessions + Users numbers are close, that means you have more unique traffic than returning traffic. Depending on your goals this can be good or bad.
But back to why this matters for you, looking at your Users count gives you an exact number of folks that you could potentially turn into subscribers or paying customers. It’s pretty cool to see what the possibilities are, right?
Jetpack

If Google Analytics has you developing a nervous tick, don’t stress over it! Instead, use the free plugin created by the team at WordPress — jetpack.
Head to Plugins > Add New + click on Jetpack (you don’t need to search cause they display it by default). Once you install it, you’ll need 2 things — a free wordpress.com account (this is not what you log into your own site with) + the site stats app activated + configured.
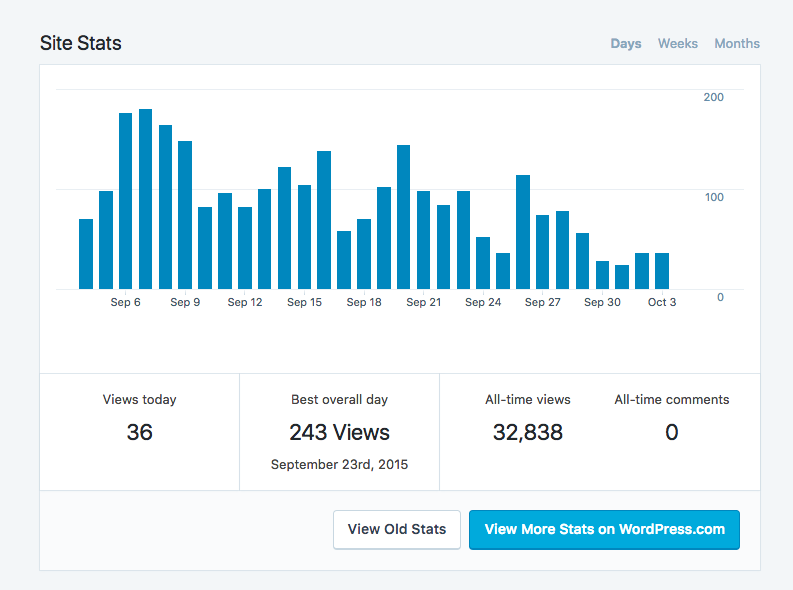
Once it’s installed + tracking for a few days, you can view your site visits right from your WordPress dashboard. Head to Jetpack > Dashboard to see your latest results.
Unlike Google Analytics, Jetpack is pretty simplified. but you’ll still be able to see how many visits you have to your site in any day, week or month. Tracking those spikes in visits will help you to understand if your Facebook group participation is paying off, or if your guest post has driven tons of folks to your site.
What I love about jetpack is that they call out your best overall day right in the dashboard view. While it may be obvious if you have a huge spike out of nowhere, if the days are closer in comparison, it can be tough to guess your best day by just glancing at the bar graph.
Hosting

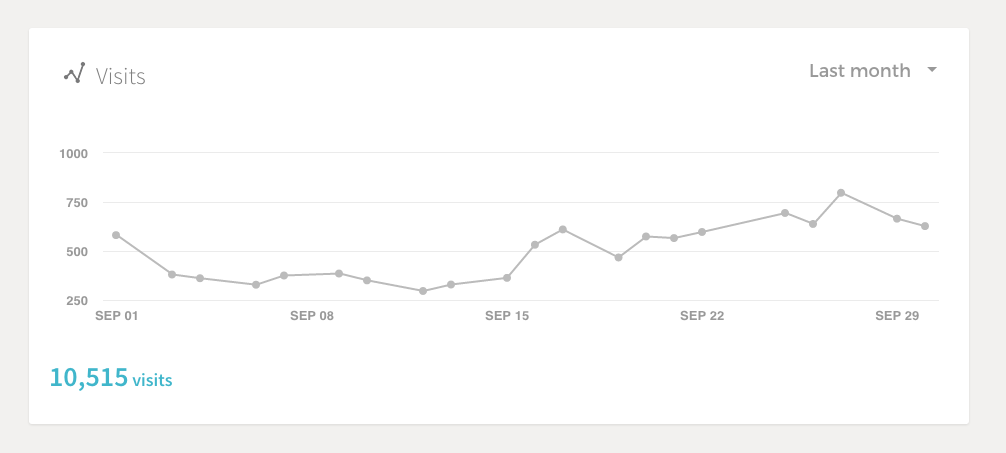
If you’re a managed WordPress hosting client of tinyblueorange, you can view your site visits right from your hosting dashboard. You don’t need to do a thing for it to work either — as soon as your site is on our managed server, we are tracking the data for you.
While this is the most simplified option of the 3, it’s also the one you have to do nothing about for it to work. If you are looking for ways to see how your different social media posts are performing based solely on traffic to your site, this is a great solution because it removes all other data clutter.
Now what?
There are 3 options for you to use + if you want, you could use all 3. But if you find yourself obsessing over the data + comparing the results across all platforms, it’s in your sanity’s best interest to pull back.
Each tracking option has their own way of doing things, so the results are going to vary. What’s important is knowing what your option tracks + what you did to reflect the stats you are seeing in front of you.
And remember, it’s very rare that you can look at data after adding your tracking solution. So if you are even thinking about looking at your numbers down the road, set up your option today. That way you can accumulate data to look at when you are ready.
