This post is all about reviewing your % exit rate on your Google Analytics dashboard. If you don’t have GA installed already, get your free account set up + running. Then after 24 hours, you’ll have some data to look at to learn what website pages are enticing folks to leave.
WTF is Exit Rate
When it comes to Google Analytics, site owners can get Exit Rate + Bounce Rate confused. The easiest way to keep the two separate is to know that Exit Rate percentages include visits where multiple pages were looked at. Bounce Rate is leaving the site from the very page you land on.
Google’s definition of Exit Rate
From the Analytics dashboard, Google defines exit rate as: % Exit is (number of exits) / (number of pageviews) for the page or set of pages. It indicates how often users exit from that page or set of pages when they view the page(s).
Is that helpful? To me, no. What’s more helpful is using real world examples.
- If you landed on this blog post from a social media link, read the article + then left.
- Now let’s say your business bff also landed on this post from the same link, read the article, clicked on another article to read, went to the nerd alert page + then left.
- And lastly, your VA started on my homepage but clicked on this blog post from there. After reading, they left the site.
Using only those 3 visits, this blog post would have a 33% Bounce Rate + 66% Exit Rate. This post was viewed in all 3 visits + with 2 of those 3 visits, the user left the site from the blog post. It doesn’t matter where users start on your site — if they view a page in their navigating the site, it counts as a pageview in the formula.
The way I like to define Exit Rate is it’s the percentage of visitors that left your site via the page in question.
Reviewing your numbers
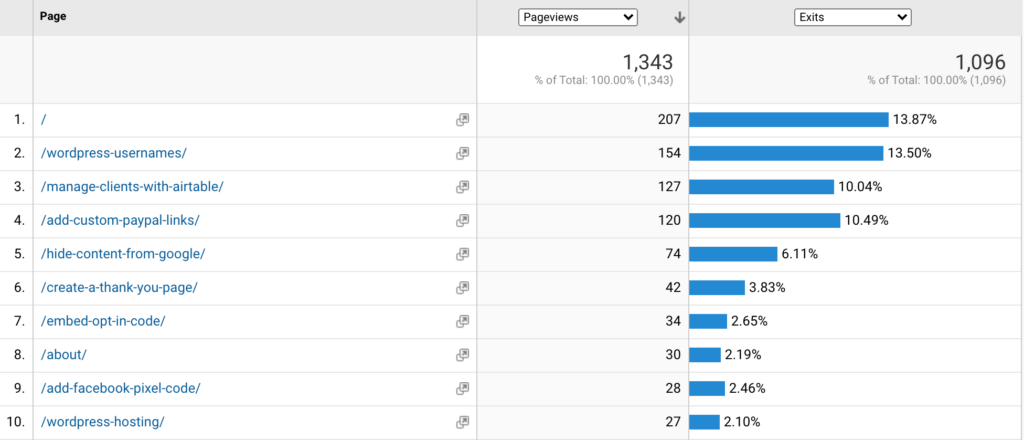
Log into your Google Analytics account. My favorite place to review exit rate is within Behavior > Site Content > All Pages. Once there, click on the “performance” icon, which is the third to last graph icon in the row. Set the second column to “Pageviews” + set the third column to “Exits” + you’ll see something like this.
I like including pageviews because it’s easy to get bogged down by a high exit rate percentage. If only 3 people have been on that page, it’s not really a priority to me. (Though getting more eyes on that content might be!)
Sometimes a high exit rate is good…
At some point, folks are going to leave your site. So when would it be ok for that to happen? The best example is if you have a thank you page for your contact form or subscription opt-in. That means the site visitor has given you permission to contact them + the ball is in your court.
…but sometimes it’s not.
My homepage having a 14% exit rate for this timeframe isn’t ideal. I want my homepage to guide users around. This could be a sign of too many options, copy that needs to be reworked, or a case of getting the wrong eyes on my site from whatever referral source was sending traffic my way.
The same can be said for your articles or podcasts + services pages. That is, if you’re not using a pop-up to gather info without routing users elsewhere on your site.
Making your site better
Ready to improve the success of your site + reduce your exit rate, where it ought to be lower? If you have the data, look at your exit rate for at least a month. Though I recommend using 3 months + ask yourself the following questions:
- How many links are available on this page? (Do they open in new tabs even though they are links to your site content? Are the links clearly links?)
- Does this content solve a problem? (Most site visitors are looking for solutions. If you don’t provide one, they will move to the next site to find help.)
- Could I route visitors to another page/post on my site that relates to this content? (This is a great chance to create a blog post series or opt-in gift.)
Once you’ve answered honestly + found some problems on your site, make those improvements. Then set a calendar reminder to review your data in 30 days. Compare the two previous months to see if your changes decreased your exit rate on the pages you worked on.
More Google Analytics numbers to know
Interested in what else Google Analytics can do for you + your business? Check out one of the website analytics posts below. Or work on reducing your WordPress Bounce Rate with this free email course. You’ll get a handful of emails walking you through the best way to reduce your Bounce Rate — including where to focus + why.